In this post, we’ll discuss the relative merits of each type of metric, paying special attention to altmetrics and their applicability to the selection of journals and books.
Traditional approaches to using metrics for collection development
The same survey referenced above found that usage statistics are the most often used metric consulted when making collection development decisions, followed by the journal impact factor and citation counts.
Journal Impact Factor and related metrics
What it is: The Journal Impact Factor is often used as a quick way to understand the influence of a journal, based upon the average number of citations any article it publishes can expect to receive. It’s a proprietary metric that calculates the average number of citations that research articles published in a particular journal have received in a two-year window.
Limitations: The Journal Impact Factor can be a quick and easy way for a non-specialist to understand which are the most influential journals in a particular discipline, but it should not be used to understand the quality of a journal, contrary to popular belief. Be sure to use the Impact Factor in combination with other metrics, to get a more complete understanding of the usefulness of the title.
The Journal Impact Factor is more often used to evaluate journals in the sciences, and has been criticized for inferior coverage for non-English language journals (due to its reliance on Web of Science citation data). Because it is based upon citation counts, the Impact Factor shares many of citation counts’ limitations (see below).
Where to access: Impact Factors for thousands of journals are available through a subscription to Thomson Reuters Journal Citation Reports. Free alternatives to the JCR include the Scimago Journal Rank and Google Scholar journal rankings. Both alternatives are based on citation data that often differs from Web of Science citation data, and thus can differ from the JIF.
Citation counts
What they are: Citation counts are article, book, or dataset-level metrics sourced from scholarly literature, whereby references to related studies are counted and aggregated. Generally, citation counts are interpreted to mean that a relatively highly-cited article is of high quality or influence.
Limitations: Citations take months or years to accumulate, making them a poor choice for understanding the academic impact of recently published work. It is usually easier to find citations to journal articles (using databases like Web of Science) than it is to find citations to books, datasets, and other “non-traditional” scholarly outputs. Citations can only highlight the scholarly influence of research; it is not possible to understand the “real world” impacts of research using citations alone. For these reasons, it is generally recommended that citation counts be supplemented with other metrics when attempting to gauge the importance of research beyond academia, or the scholarly impacts of recently published research.
Research has shown that the motivations behind citations are many (negative citations account for 5-14% of the literature), so high citation counts should not always be taken at face value.
Where to access: Citation counts are available for articles, books, and datasets through subscriptions to:
Citation counts are also freely available via Google Scholar (and the related desktop tool Publish or Perish). However, Google Scholar indexes content that is not always peer-reviewed, calling into question the quality or usefulness of the citations in understanding disciplinary impact.
Usage statistics
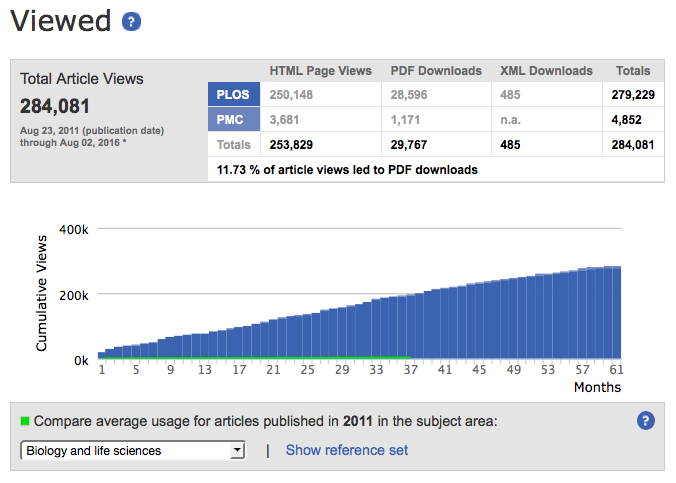 |
| Article-level usage statistics, reported by PLOS |
Limitations: Usage statistics are especially susceptible to manipulation and gaming. This fact necessitated the creation of Project COUNTER, an initiative that sets standards for recording, cleaning, and reporting usage statistics, but that is not itself without limitations. Not all publishers are COUNTER-compliant. Most COUNTER-compliant reporting standards report on usage at the journal-level, rather than the article-level.
Though they are commonly interpreted to directly measure readership, usage statistics actually only measure clicks and views and instead serve as an indicator for readership.
 |
| COUNTER data collection survey results from Welker, 2012 |
Reporting services do exist for COUNTER-compliant usage statistics: ProQuest’s COUNTER 360 and similar commercial tools aggregate much of this data for its subscribers, and in the UK the Journal Usage Statistics Portal (JUSP) offers similar features.
Using altmetrics for collection development

What they are: Altmetrics are attention data from the social web that can help librarians understood which articles, journals, books, datasets, or other scholarly outputs are being discussed, shared, recommended, saved, or otherwise used online. They can be reported at the item-, journal-, or author-level. Altmetrics can shed light on non-traditional scholarly uses of research (i.e. when students have bookmarked an article that they find useful due to an excellent Methods section) but also on the use of research by the public, practitioners, and other stakeholder groups. These insights can be useful for librarians making collection management decisions for “applied” disciplines or professional degree-granting programs.
Limitations: Altmetrics are a relatively young class of indicator, and as such not much is known about the meanings behind altmetrics. Therefore, quantitative altmetrics data (the metrics themselves) should only be interpreted to understand the volume of attention being paid to research. Manual work is needed to assess the underlying qualitative data that makes up the metrics (who is saying what about research). While altmetrics are good at identifying “trending” research, they have not yet been proven to be a good indicator for lasting, long-term impact. Librarians seeking to evaluate non-English-language sources will find that altmetrics coverage is currently limited for these outputs, no matter the altmetrics service used.
Where to access: Currently, the only altmetrics aggregator that allows librarians to search by topic, journal, etc and also among an institution’s scholarship is Altmetric Explorer for Institutions. Limited analysis can also be done using the Altmetric Explorer for Librarians tool. Altmetrics for individual articles, books, and other outputs can be found using the Altmetric bookmarklet, and also (in the case of journal articles and select books) collected from many publishers’ websites.
Example: Evaluating Journals

Though altmetrics tend to be reported at the article-level (a phenomenon you’ve likely seen if you’ve ever encountered an Altmetric badge on a journal article’s webpage), it is possible to find journal-level altmetrics using the Altmetric Explorer database.
At ER&L 2016, librarians from the Mt. Sinai Icahn School of Medicine explained how they use Altmetric Explorer data for collection development.
Journal-level usage statistics (usually provided by COUNTER-compliant publishers) and cost-per-use (a metric generated in-house, using Icahn School of Medicine purchasing data) are examined alongside aggregated, journal-level Altmetric scores (seen in the illustration above) to understand how different types of resources garner different types of attention, and thus may each have differing values to an organization like a medical school.
Elsa Anderson (Deputy Director, Collections, Icahn School of Medicine at Mount Sinai) described the median Altmetric score as perhaps the most useful indicator for comparing journals with different levels of yearly publication volumes (because can you really compare raw, aggregated usage stats for a journal that only publishes 200 articles a year to one that publishes 2,000 articles a year?)
Moving forward, the team is very interested in combining disparate data types into a single, weighted indicator that allows them to accurately evaluate different types of publications (for example, the Pediatric Care Newsletter and the American Journal of Pediatric Care) at a glance.
Example: Evaluating Books
Let’s say there are a handful of ebooks in a package that you’re renegotiating with a vendor, and you’re not sure how useful they are to your community and beyond.
Publisher-supplied ebook usage statistics are a solid real-time indicator for campus interest in these titles. These tell you whether or not the books are being accessed by your patrons (an indicator for recent readership).
Beyond your campus, WorldCat-reported library holdings (i.e. whether or not these titles are owned by peer institutions; an example can be seen below) can help you understand if these titles are popular elsewhere–perhaps an indicator for future interest in these titles.

To find WorldCat library holdings, simply search for your title(s) from the WorldCat homepage, then find it in the list of search results. On the item page, you can see the total number of libraries that own that book under the “Find a Copy in the Library” section.
Alternatively, you might look up GoodReads ratings for the titles, or book reviews submitted to Amazon.com.
When combined with other data points (book reviews, faculty requests, etc), these metrics can make useful yardstick by which to make decisions about which books and packages to purchase.
Beyond making purchasing decisions for books and journals, there are many other ways you can use altmetrics to inform your collection management decisions. How do you use altmetrics for collection development?
Portions of this post were adapted from “What I learned about the realities of altmetrics, data visualization, and collection management at ER&L 2016” (April 2016)
Autor: Stacy Konkiel
Twitter: <@skonkiel>
Fuente: <http://www.altmetric.com/>
No hay comentarios.:
Publicar un comentario